The Cap Hit Leaders chart on our home page ranks every club by spending. It doesn’t say anything about whether that spending works. So we pulled this season’s standings — points, not vibes — and lined them up against each club’s Est. Cap Hit, where that cap hit actually goes by position group, and how many Designated Player and U22 Initiative slots each club is using. Across all 30 clubs, a few patterns hold up. None of them are what a bigger-budget club wants to hear.
Money buys a little. Not a lot.
Across the league, a club’s Est. Cap Hit and its points this season correlate at r = 0.36. Squared, that’s roughly 13% — cap hit statistically accounts for about one-eighth of the variation in how many points a club ends up with. The other seven-eighths is everything else: player development, health, coaching, finishing luck, schedule, all of it.
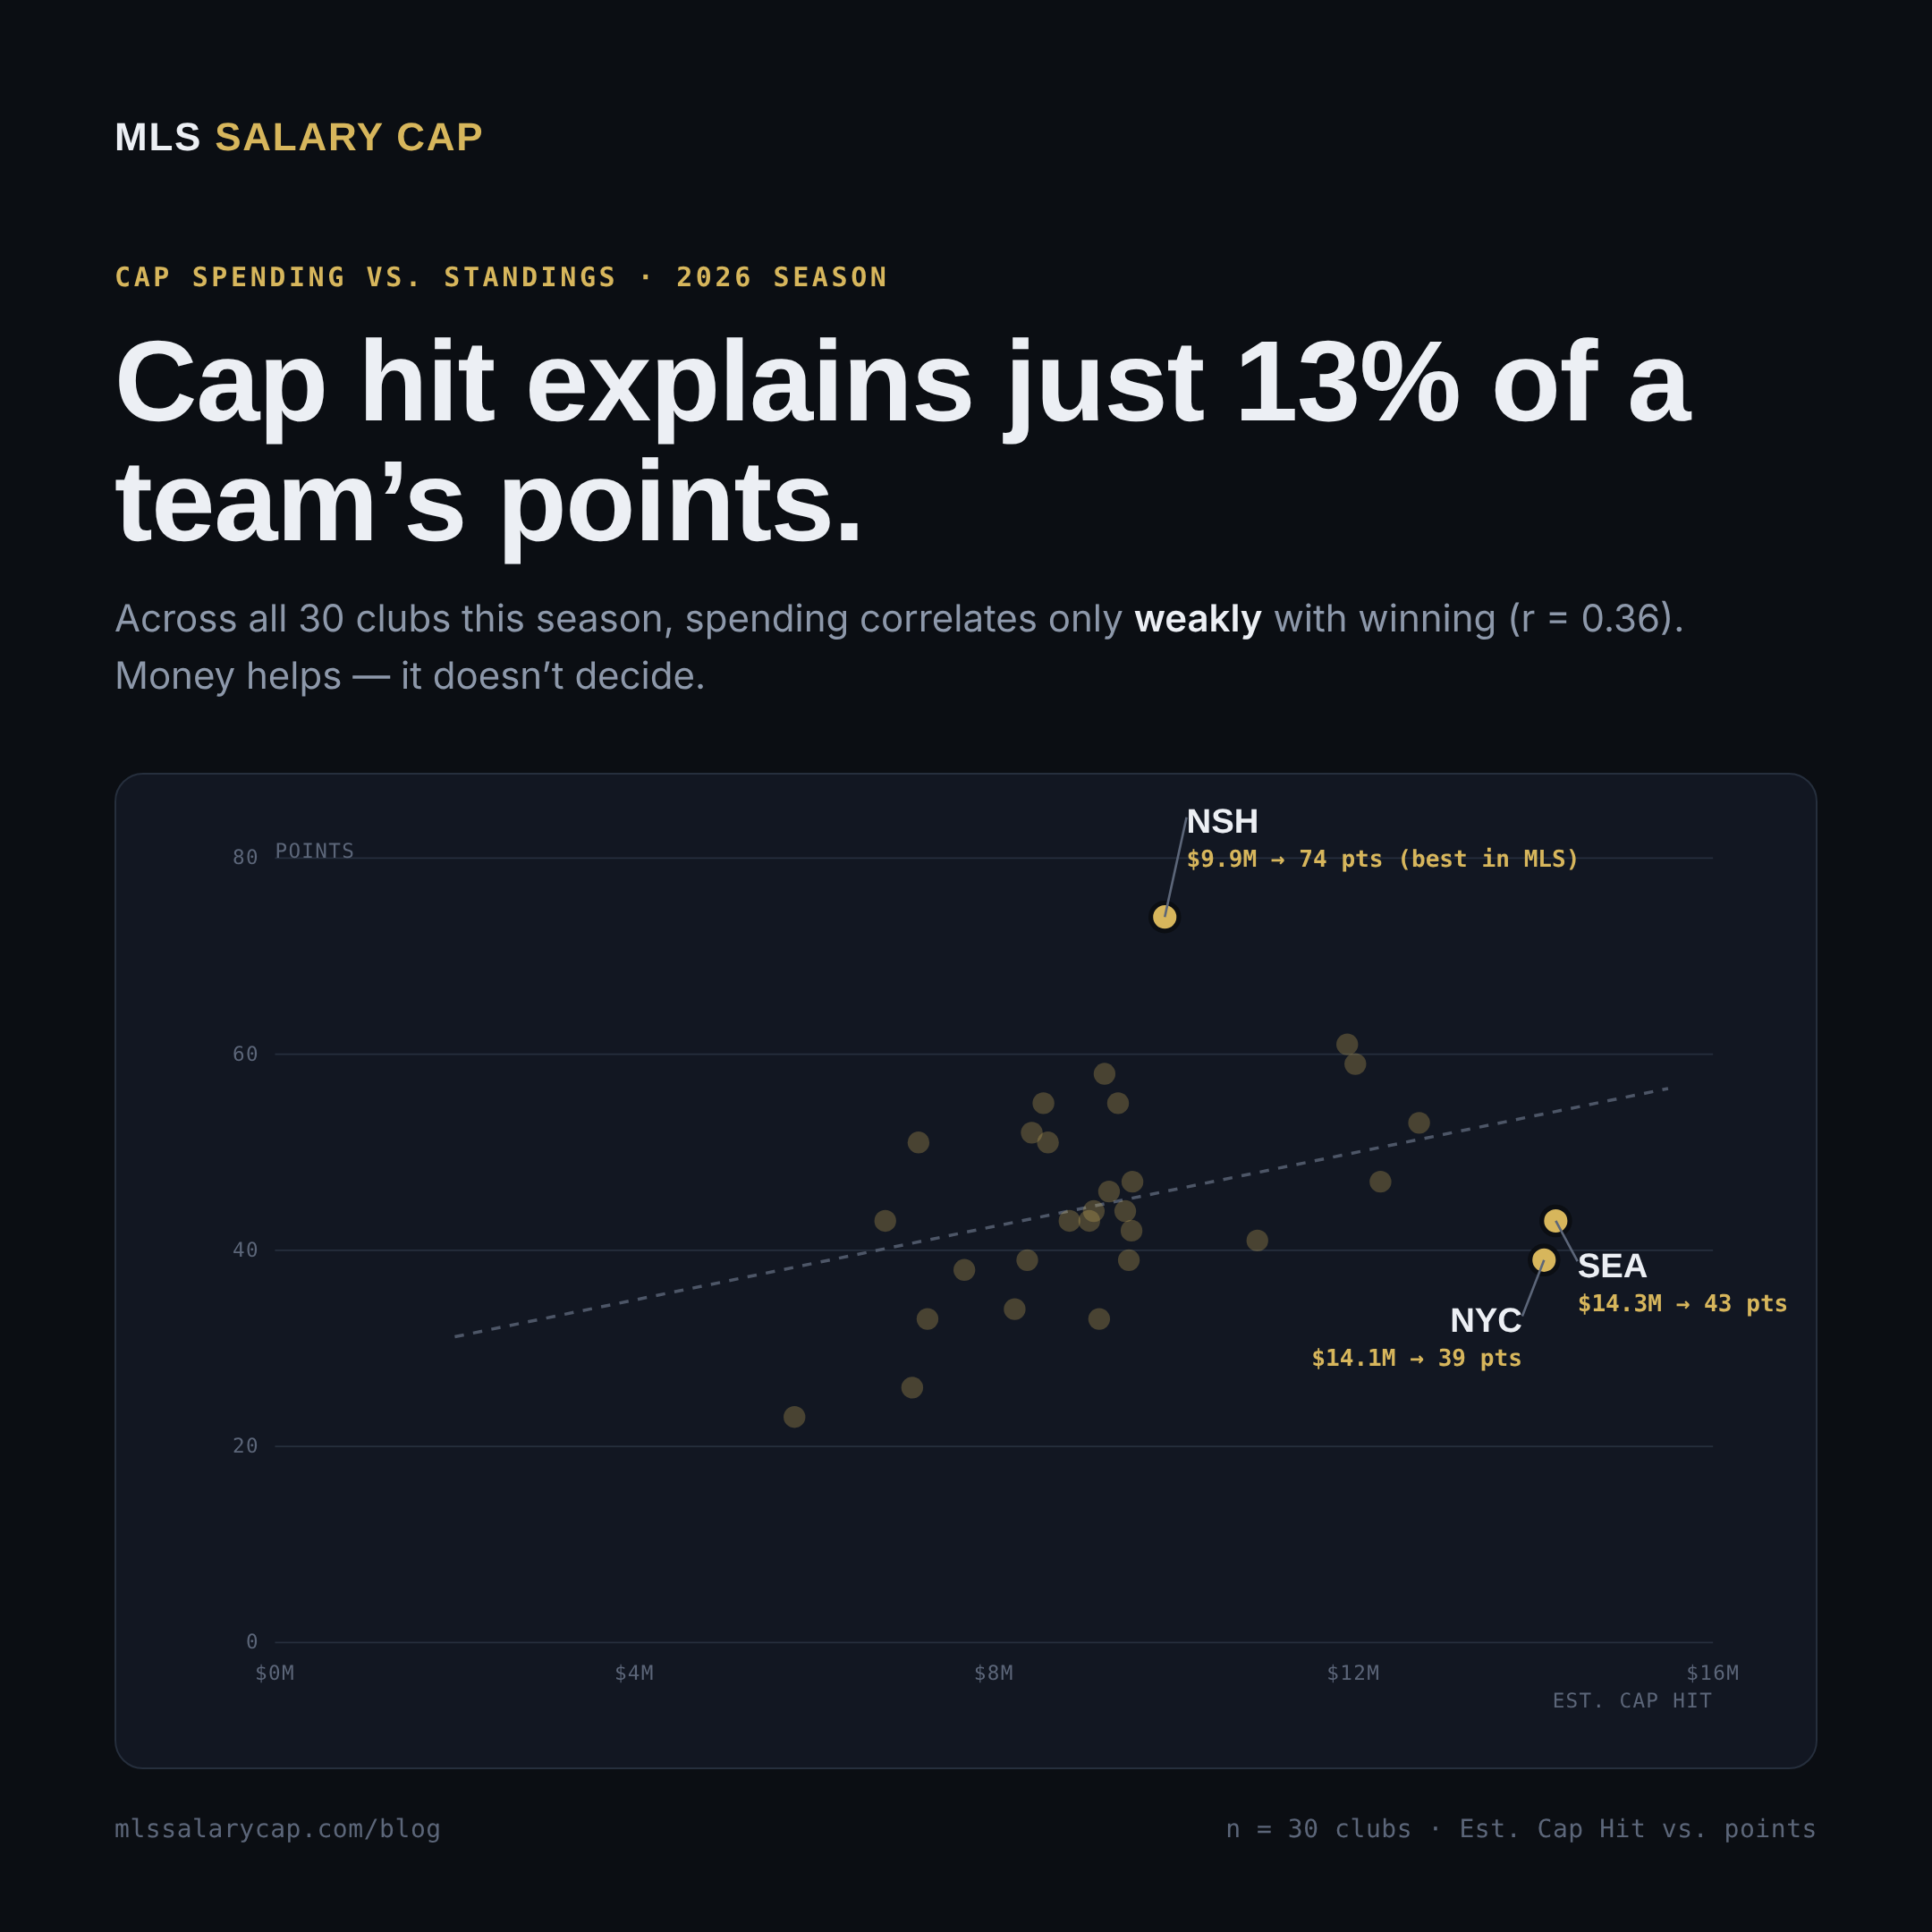
The three clubs furthest from that trend line tell the story on their own. Nashville SC had the most points in MLS this season (74) on a $9.9M cap hit — the league’s 8th-highest, essentially a middle-of-the-pack spend, not a budget pick. On the other end, Seattle Sounders FC carried the league’s highest cap hit ($14.3M) and finished 19th of 30 in points (43). New York City FC had the 2nd-highest cap hit ($14.1M) and finished 22nd of 30 (39 points). Spending the most bought Seattle and NYC a below-average season.
Where the money goes matters more than how much there is
We broke each club’s Est. Cap Hit down by position group — the same GK/DEF/MID/FWD split already on our home page — as a share of that club’s total spend, and correlated each share against points per game.
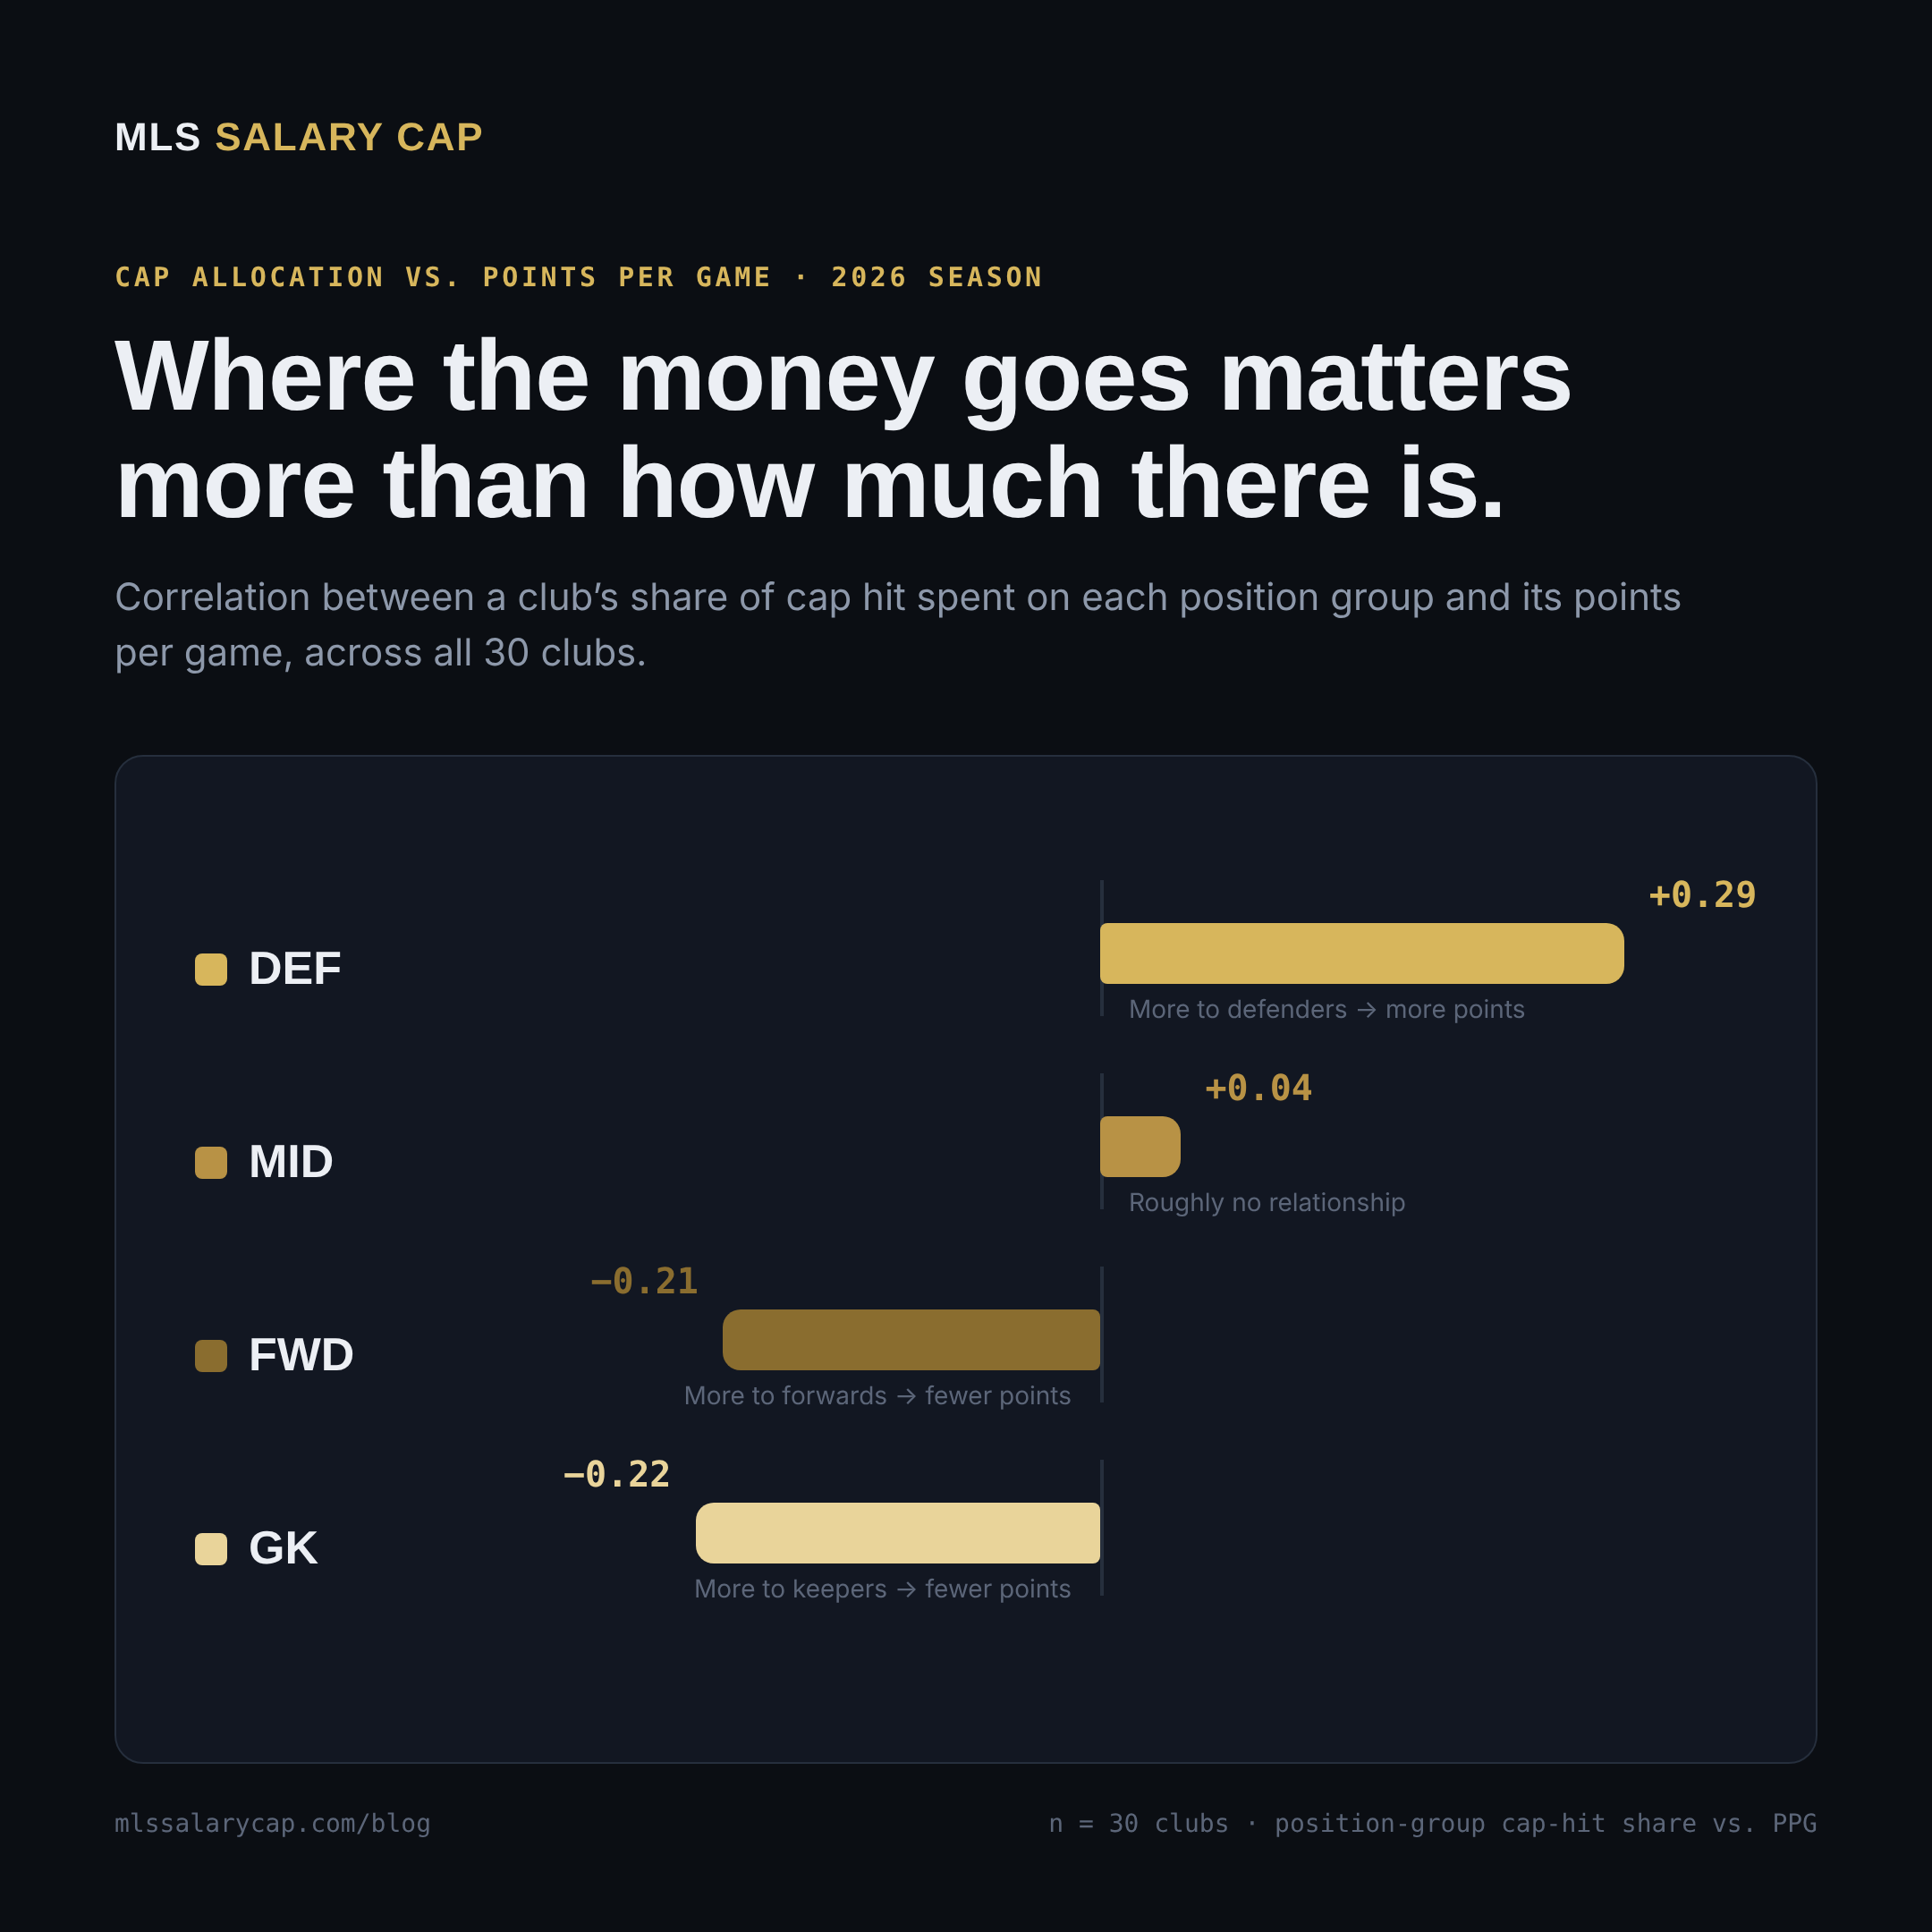
A club that puts a bigger share of its budget into defenders tends to finish higher (r = +0.29) — the clearest single relationship in this whole dataset. Spending more of the budget on forwards (r = −0.21) or goalkeepers (r = −0.22) points the other way. Midfield spend share is close to flat (r = +0.04) — it doesn’t predict much either way.
We’d be careful not to oversell this as “defense wins championships, proven.” A correlation this size doesn’t say defensive spending causes wins — it’s just as plausible that clubs who are already good at recruiting tend to get both right. But directionally, it’s the opposite of how a lot of MLS cap space gets spent: the biggest Designated Player fees in the league go to forwards and attacking midfielders almost every window.
The Designated Player myth, and the U22 edge
We also checked each club’s designation counts — how many Designated Player and U22 Initiative slots they’re using — against points per game.
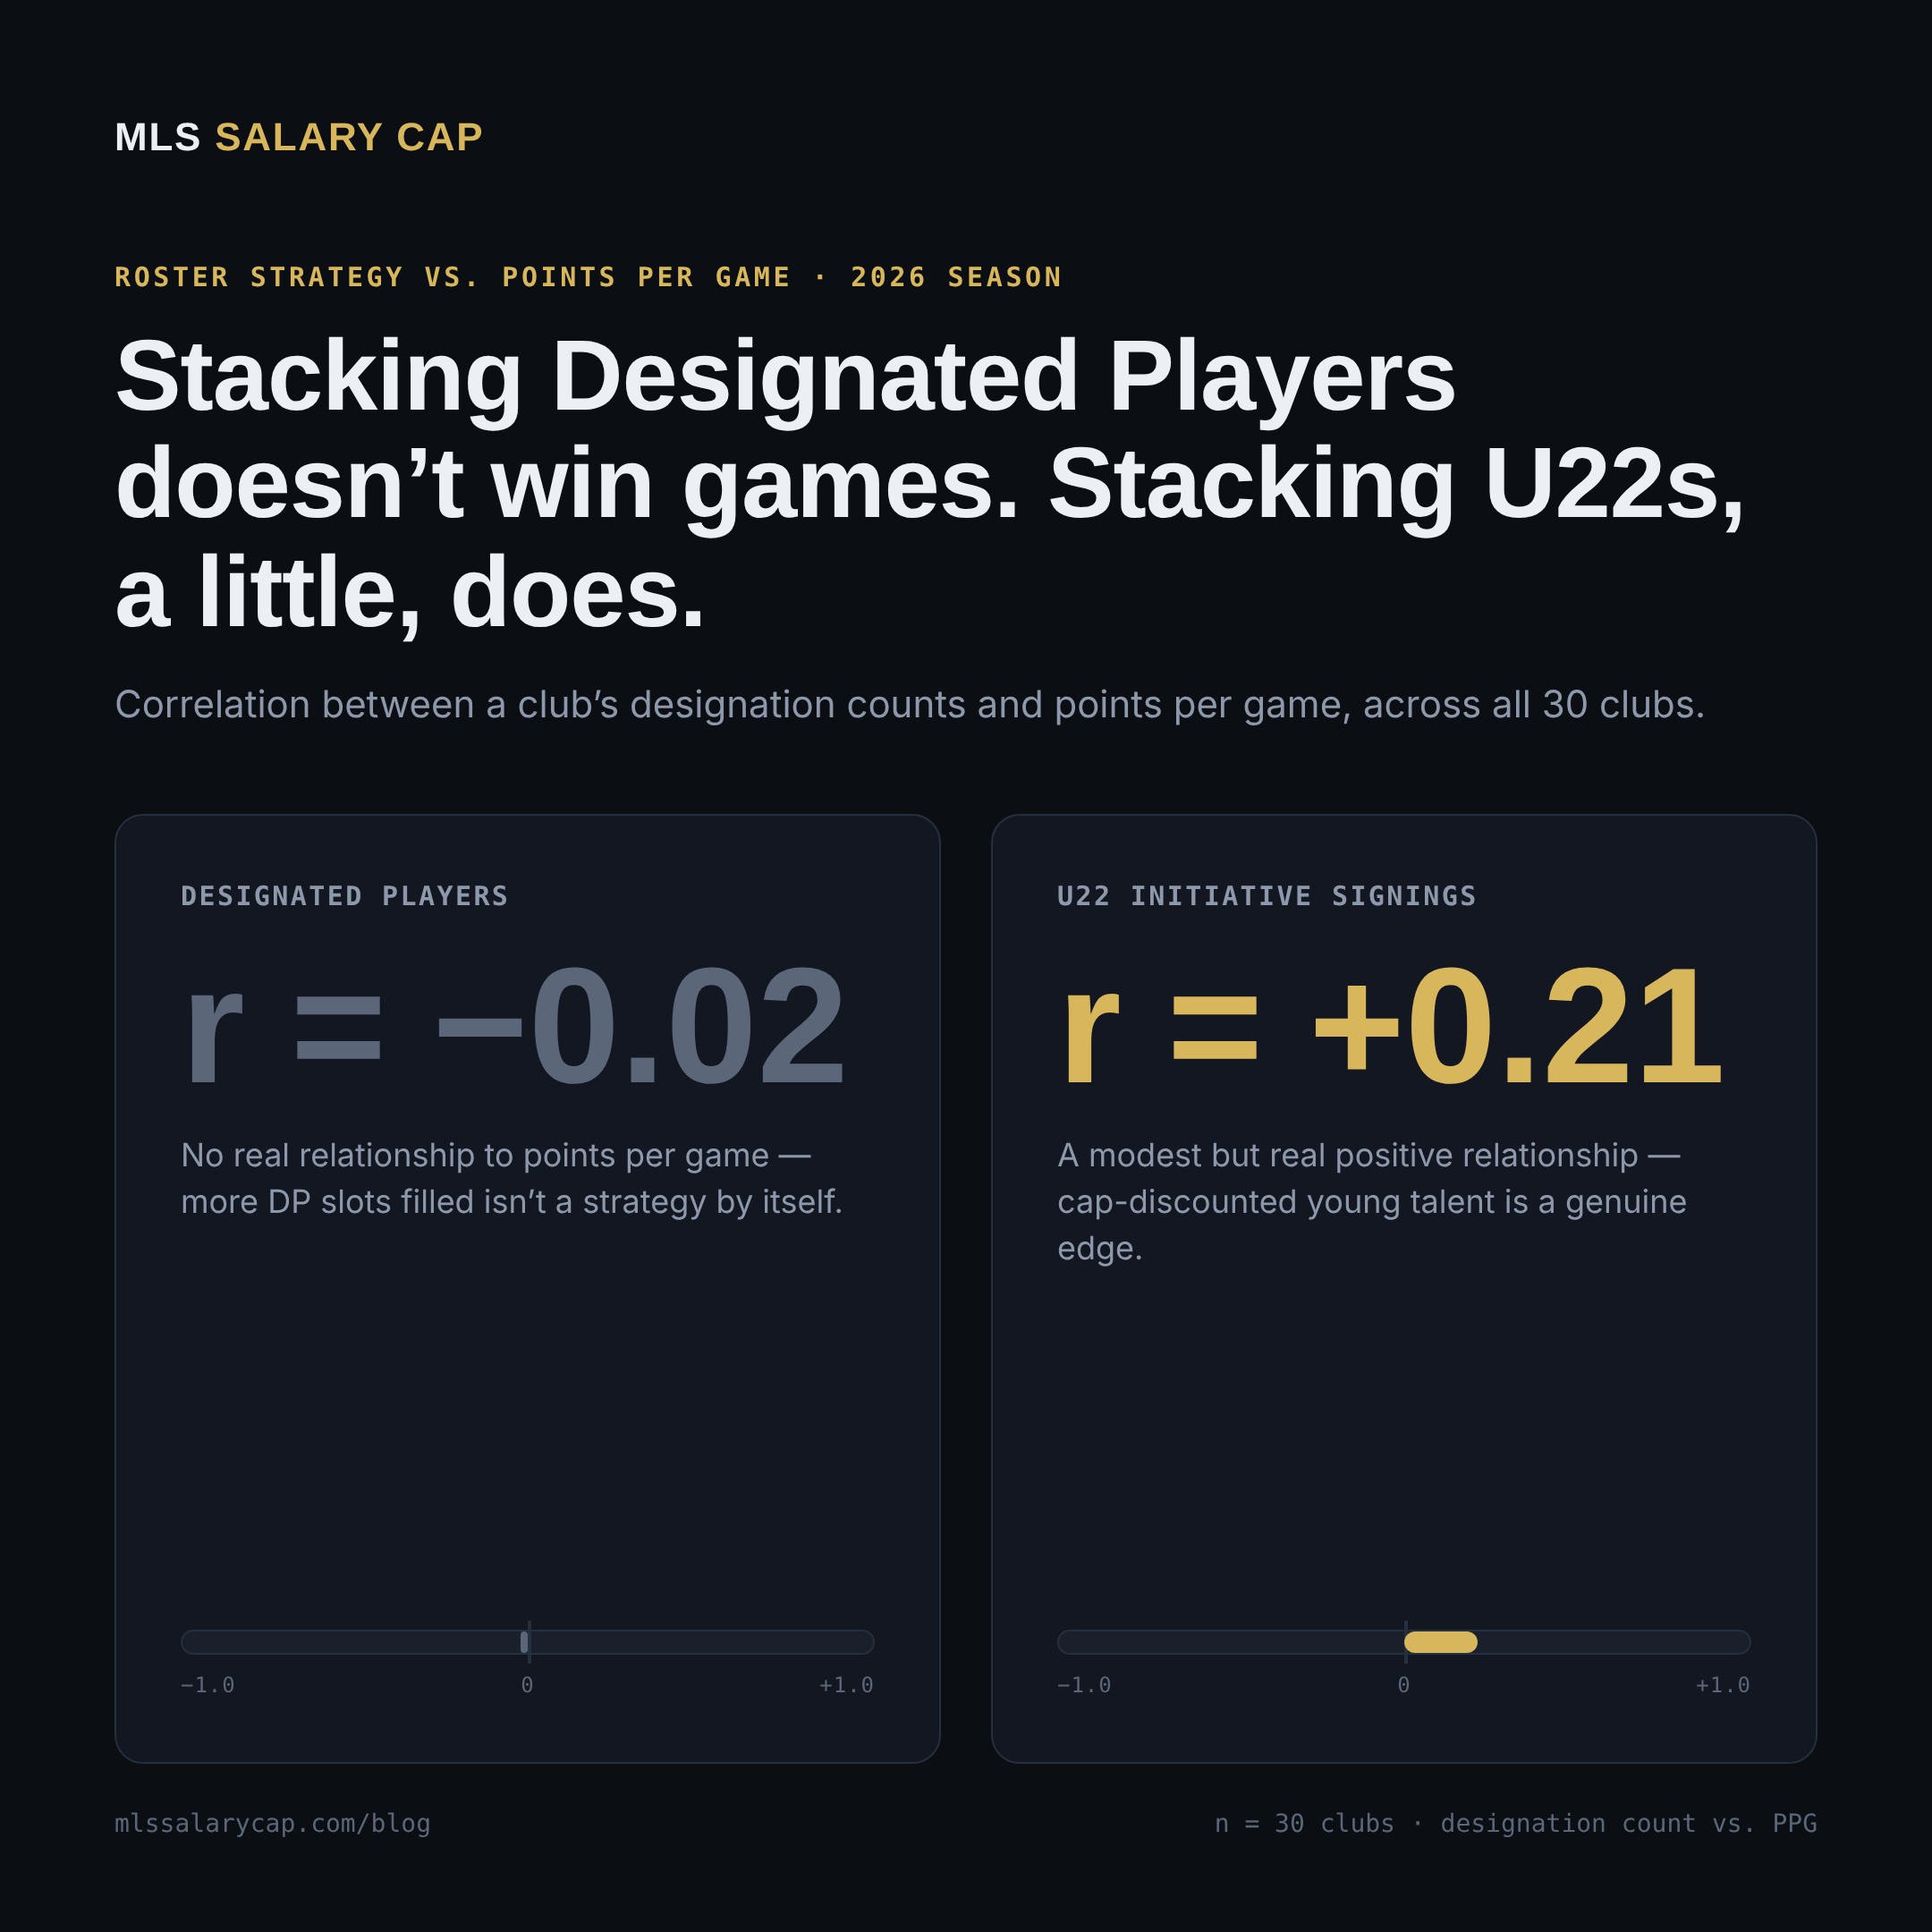
Designated Player count doesn’t predict points at all (r = −0.02, functionally zero). Filling all three DP slots isn’t a strategy by itself — it matters entirely on who those three are, which this correlation can’t see and neither can a roster sheet. Among our top-8 clubs by points per game this season, the average DP count (1.9) was actually lower than among the bottom 8 (2.4).
U22 Initiative count has a real, if modest, positive relationship (r = +0.21). The top-8 clubs by points per game averaged 2.75 U22 signings; the bottom 8 averaged 1.75. The mechanism isn’t mysterious: a U22 Initiative signing counts a steep, fixed discount against the budget regardless of what they’re actually paid (see Salary Rules), so even solid-not-spectacular production from one is cap-efficient almost by construction. It’s a market inefficiency sitting in plain sight on every team’s cap sheet.
All the underlying figures here come straight from the same synced data behind the rest of this site — see the home page’s Cap Hit Leaders chart for the live, per-club breakdown, Best Value for player-level cap efficiency, and Production Index for on-field output by position. If a club’s numbers here don’t match what you remember from a given week, ours update weekly and reflect the latest sync.